+86 13962283116
© 2018 Zhangjiagang YUSHENG MachineryAll rights reserved. Site Map Designed by iwonder.cn

The energy used to mold plastics, and the cost of that energy, is a hot topic throughout the molding business these days. Going beyond the talk takes an organized approach that, fortunately, is neither difficult nor costly. Here molding consultant Robin Kent guides you straight to it.
Ten years ago it was hard to interest molders and machine manufacturers in the topic of energy use in injection molding. Now it appears that this is all that machinery and ancillary suppliers can talk about. But how does a molder understand what’s really happening, assess a current injection molding machine (IM), and tell how energy efficient it is?
The injection molding energy cycle
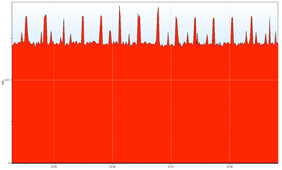
 It is relatively easy to monitor the energy use in an IM—a typical trace of kWh vs. time is shown in Figure 1. The molding cycle is clearly visible and, in this case, very consistent with a regular energy peak most likely corresponding to the injection phase every 26 seconds. Using the energy trace, it is possible to see the machine movements that consume energy and to see the unique signature trace of the machine and settings. This ability to look inside the cycle at the instantaneous energy use is a tool that can be used to understand a machine’s performance. Here are some of the features of the energy trace: Idling energy. IMs use energy even when idling. While the amount varies with the machine, a typical value is in the region of 52%-97.5% of the full molding energy consumption. The full trace of the IM monitored in Figure 1 is shown in Figure 2.
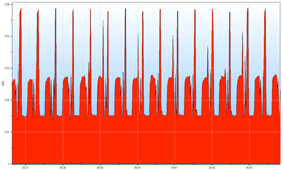
The machine was idling in the first flat section of the trace—that is, the was motor on and ready to produce but stopped awaiting a technician. During this time, the energy used was 64% of the full production energy usage and the machine was costing more than $3/hr simply sitting there. All the energy in the left-hand side of the trace was lost forever. What is the idling cost of your machines and what are you doing about it? An idling machine is not “free,” even if the motor is turned off—it is still costing money to operate heaters and other ancillaries. Idle periods of greater than 1.5 hours may make it cheaper to switch off and restart. • Tip: Define an “idling” mode for all machines—motors off and heaters reduced. Implement this as soon as possible to reduce energy use when idling. • Tip: Stop supplying services (compressed air and cooling water) to idle machines. • Tip: Design handling systems to operate on-demand only and make sure that they stop when machines are not producing products. Base load. IMs have a “base load” that depends on the energy losses of the system and a “process load” that depends on the product being molded. The base load varies with the specific IM. Figures 3 and 4 show two different machines with very different base and product loads, despite the fact that they were molding very similar products. |
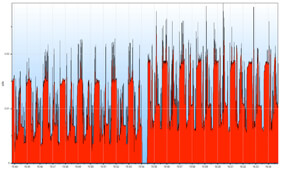
 In Figure 3, the IM has a very high base load and the product load is effectively dwarfed it. For this IM, the actual molding of the product costs very little; most of the energy is in the machine losses. Figure 4, on the other hand, shows an IM with a more typical base load (about 75% of the average load). For this IM, the base load and the process load are more typical; however, some machines have a base load as low as 40%. One of the main reasons for a high base load in relation to the process load is the incorrect choice of machine. Using large machines for small products is energy inefficient. The injection unit size should be closely matched to the product size as well. • Tip: Selecting the right machine for the job is vital. The machine capacity should be closely matched to the product to minimize the effect of the base load. • Tip: Large motors at partial load are less efficient than small motors at full load. IMs are most efficient near their design load, and total machine energy efficiency decreases as the operating conditions move away from the original design conditions. • Tip: Initial cost of an IM will be less than the cost of energy used during its lifetime. Energy-efficient IMs may cost more initially but will save money in the long term—an important factor as customers are beginning to expect price decreases through the lifetime of a product. • Tip: Use whole-life costing when purchasing new IMs and include the energy costs in the calculations. • Tip: Ask for data on IM energy usage as part of the purchasing process. • Tip: Investigate using accumulators to minimize peak power. Peak power is only needed for a short time but can decide the size and pressure setting of the main hydraulic power pack (which is therefore overrated for most of the time). Accumulators can store energy for rapid release during injection and allow a significant size reduction in the hydraulic system and base loads. |
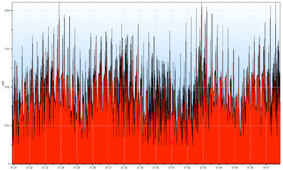
 Cycle consistency and reproducibility. The energy trace also allows cycle consistency to be examined. Figure 5 shows an IM with an extremely inconsistent cycle. For this IM, the base load and the process load both vary significantly over time, and the cycle is highly irregular and difficult to see. While it is not always true, in this case the IM/product combination showed quality problems on a regular basis due to the company’s fascination with cycle time rather than consistent molding. IMs have a maximum operating speed attributed to simple inertia; trying to exceed this can sacrifice quality for speed—not always a fair exchange. • Tip: A consistent energy cycle generally indicates an IM producing consistent products. • Tip: Monitoring energy use will identify changes in the machine condition—for instance, increased energy use is a good indicator of screw or barrel wear. Tip: Good maintenance can give significant energy savings. Look at areas such as temperature controls, hydraulic valves, hydraulic oil viscosity, and screw wear. Process setting. Process setting has an obvious and direct influence on energy usage, but there has been very little work carried out to link the two. Scientific methods are available to improve settings for increased reliability and productivity, but no method currently includes an assessment of the process energy use. Optimizing the process through settings will minimize energy use in many areas—for instance, it will minimize cycle times and the cooling required—but reducing energy usage is currently seen as a byproduct rather than as a specific aim of process setting. |
 Machine variations All of the traces shown so far have been for conventional hydraulic machines, but these are not the only type of machine available. VFD machines. Some manufacturers produce hydraulic IMs with an integral variable-frequency-drive (VFD) control for the motor. In this case, the speed of the hydraulic pump is continuously adjusted throughout the cycle to minimize the energy use. A typical trace is shown in Figure 6. The left-hand trace is with the VFD switched on. For the right-hand trace, the VFD was switched off. The increase in the base and peak loads is clear: The machine used 22% less energy with the VFD switched on than with it switched off. The molder made sure to switch the VFD back on after the monitoring was complete! |
 All-electric machines. The obvious candidate for improved energy efficiency is the all-electric IM. These are much more energy efficient and are a natural purchase decision in most cases. A typical trace for an all-electric machine is shown in Figure 7—random and almost chaotic. All-electric IMs usually overlap movements (and energy use) because they are not limited by the hydraulic pump and have motors for different purposes. An all-electric trace often will have this type of appearance, and even though the energy use is greatly reduced, the trace is less clear for analysis. Real life monitoring: getting your own traces and numbers Machine monitoring is noninvasive. Measurement and analysis can take as little as 30 minutes for a single machine. The production staff is always amazed at the amount of information that is easily available. Machine monitoring can be carried out using a clamp meter data logger. The one we use (called the SPC Mini from Elcomponent Ltd.) costs only $400 and comes with the software that generated all the graphics in this article. A simple handheld clamp meter can be used to get an approximate reading but rapid cyclic changes usually make a data logger meter necessary. Typically, an IM is fed by a three-phase supply, which is split into feeds for motor, heaters, and other ancillaries. Measurement of the combined or separate feeds is usually possible from the control cabinet, but be certain always to record what was actually measured. The machine movements should follow a regular pattern. However, the barrel heaters are switched by their controls and can cause some irregularity. The heater load will fluctuate as individual heaters are switched on and off, but an average can be observed over 10-15 minutes. • Tip: It may be possible to measure the complete machine from a distribution board, but care should be taken of possible voltage drops if the cabling is very long—the voltage at the machine may be reduced from the voltage at the distribution board. • Tip: Check that the phases are balanced before making measurements. This is not always the case and results may need adjustment. • Tip: Check for multiple conductors. In some cases, the wiring uses two or more wires in parallel. Simply measure one wire and multiply by the number of wires used to feed the IM. Warning: Making electrical measurements should always be carried out using standard safety precautions. If you don’t know what these are, then ask a suitably qualified person. Be safe and follow any local or country regulations regarding access to live conductors. What do you do next? Energy use traces provide molders with a wealth of information that they can use to assess idling costs, assess base and process loads, assess consistency, investigate process setting for energy use minimization, and assess overall machine performance. The real question is, “Why are so few molders using this simple technique to investigate one of the fastest-rising costs that they face today?” What’s stopping you? |